Lock escalation is a event which occurs when SQL Server decides to upgrade a lock at a lower level hierarchy to a lock to a table level lock., In other words, when a particular query obtains a large number of row level locks/ page level locks, SQL Server decides that instead of creating and granting number of row level/page level locks, it is effective to grant a single table level lock. Or to be precise,
SQL Server upgrades the row/page level locks to table level locks. The above process is termed as lock escalation.
Lock escalation is good, as it reduces the overhead in maintaining a large number of smaller level locks. A lock structure is about occupies about 100 bytes of memory and too many locks can cause a memory pressure.Similarly applying,granting , and releasing locks for each row or page is a resource consuming processes which can be reduced by lock escalation. However, Lock escalation also reduces concurrency. ie, If a query causes lock escalation, then the query obtains a full table level lock, and another query attempting to access the table will have to wait till the first query releases the lock.
How SQL Server decides when to escalate lock ?
* When a query consumes more than 5000 locks per index / heap.
* When the lock monitor consumes more than 40% of the static memory or non AWE alloted memory.
So Let us quickly see lock escalation in action. Consider the following query
SET ROWCOUNT 4990
GO
BEGIN TRAN
UPDATE orders
SET order_description = order_description + ' '
--Rollback
The orders table has a clustered index. Row level locks will be taken on the index keys. SET ROWCOUNT ensures that only 4990 rows are updated by the query. I am leaving the transaction open ( without committing or rolling back ) , so that we can see the number of locks held by the query.
Fire the following query to check the locks held by the above script. The query lists the count of locks for each lock type and object. Note that the session id for the above script on my machine was 53. So filtering by the same.
SELECT spid,
COUNT(*),
request_mode,
[resource_associated_entity_id],
sys.dm_tran_locks.resource_type AS object_type,
Db_name(sysprocesses.dbid) AS dbname
FROM sys.dm_tran_locks,
sys.sysprocesses
OUTER APPLY Fn_get_sql(sql_handle)
WHERE spid = 53
AND sys.dm_tran_locks.request_session_id = 53
AND sys.dm_tran_locks.resource_type IN ( 'page', 'key', 'object' )
AND Db_name(sysprocesses.dbid) = 'dbadb'
GROUP BY spid,
[resource_associated_entity_id],
request_mode,
sys.dm_tran_locks.resource_type,
Db_name(sysprocesses.dbid)
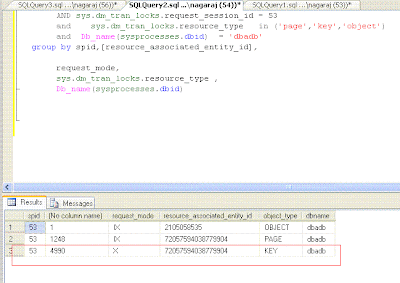
As one may notice, we can find 4990 key locks / row level locks. Let us rollback transaction and modify the script to use 5000 or more locks.
SET ROWCOUNT 5000
GO
BEGIN TRAN
UPDATE orders
SET order_description = order_description + ' '
--Rollback
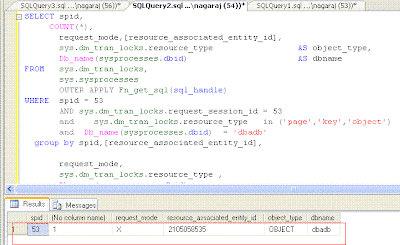
Now let us fire the same query on sys.dm_tran_locks. we obtain a single exclusive lock on the table/object. There are no key or row level locks as SQL Server as per its rule has escalated the row level locks to a table level lock.
SQL Server 2005 had a server wide setting to disable lock escalations. On SQL Server 2005, when the trace flag 1211/1224 are set, no query is allowed to escalate locks on the entire server. Ideally, we would like to have it as a object/table level setting which was provided by SQL Server 2008. SQL Server 2008 allows one to disable lock escalations at table/ partition levels.
Consider the following command in SQL 2k8
ALTER TABLE orders SET CONSTRAINT (LOCK_ESCALATION = DISABLE )
GO
The ALTER TABLE command's LOCK_ESCALATION property accepts three values.
* Disable -> Disables lock escalation ( Except a few exceptions . Refer Books online for details )
* Table -> Allows SQL Server to escalate to table level. That is the default setting.
* Auto -> Escalation will be partition level if the table is partitioned. Else escalation is always up to table level.
Let us rollback the open transaction created earlier and run the ALTER TABLE command posted above to disable lock escalations. Now let us run the same script to update 5000 records again and see if lock escalation has actually occurred.
As you may now notice, for the same 5000 rows, there is no lock escalation occuring this time as we have disabled it using the ALTER TABLE command. The picture shows 5000 key/row locks which is not possible at the default setting of lock escalation.
The intention behind this post was to introduce lock escalation, show how it works and also explain the new option provided to change lock escalation setting SQL Server 2008. Upcoming posts, we will dive deeper into the topic and understand when and under what circumstances can we play with lock escalation setting.
Monday, November 29, 2010
Lock escalation : SQL Server 2008
Tuesday, November 16, 2010
Backup log Truncate_Only in SQL Server 2008
BACKUP LOG <db_name> WITH truncate_only command, used for clearing the log file, is deprecated in SQL Server 2008. So this post will explain option available in SQL Server 2008 for truncating the log.
Step 1: Change the recovery model to Simple
USE [master]
GO
ALTER DATABASE [dbadb]
SET recovery simple WITH no_wait
GO
Step 2: Issue a checkpoint
One can issue a checkpoint using the following command.
CHECKPOINT
GO
Checkpoint process writes all the dirty pages in the memory to disk. On a simple recovery mode, the checkpoint process clears the inactive portion of the transaction log.
Step 3: Shrink the log file
USE dbadb
GO
DBCC shrinkfile(2, 2, truncateonly)
Shrinking the log file with a truncateonly option clears the unused space at the end of the log file. First parameter of the Shrinkfile takes the filed id within the database. Mostly the fileid of the log file is 2. You may verify the same by firing a query on sysfiles.
Step 4: Change the recovery model back to full/bulk logged
Change the recovery model to the recovery model originally ( full/bulk logged ) used by the database.
USE [master]
GO
ALTER DATABASE [dbadb]
SET recovery FULL WITH no_wait
GO
After these steps the log file size should have reduced.
The intention behind this post is not to encourage truncating the log files. Use the method explained, only when you are running short of disk space because of a log file growth. Note that, Just like truncating log files, Changing the recovery model also disturbs the log chain. After clearing the log using the above method, you need to either run a full backup/Differential backup to keep your log chain intact for any recovery.
Just a quick demo to show that the log chain breaks if you change the recovery model.
The database whose log file we will be clearing is dbadb. Log file size 643 MB as shown below.
After executing the scripts mentioned above, the log file size is 2 MB as shown below.
The log chain breaks after changing the recovery model. When log chain breaks, subsequent transaction log backups start failing as shown below.
Transaction log backups will be successful only after the execution of full or differential backup.
PS: Pardon me for a SQL 2k8 post, when the whole world is going crazy about
SQL Denali :)
Tuesday, November 9, 2010
Finding CPU Pressure - dm_os_schedulers DMV
The last post dealt with checking CPU pressure using wait_stats DMV. But, to get a complete picture of CPU Pressure, the script provided in the previous post alone wouldn't suffice. We need the help of additional DMV
sys.dm_os_schedulers.
Why we need the help of sys.dm_os_schedulers?
As already mentioned, Waitstats DMV captures waiting time for a group of wait types. WaitStats DMV works in the following way. WaitStats checks whether any processes waits at any of the defined wait types. If yes, then WaitStats tracks resource wait time experienced by the process. After the resource wait is over, waitstats tracks the signal wait/CPU wait. Once, both the waits are completed, the waitstats reflect in the DMV.
There have been scenarios where a process doesn't experience any resource wait and just has a CPU wait/Signal wait. In such a case, the waiting time misses the wait stats, and wait stats doesn't reflect the CPU pressure experienced at all. In other words, if a process doesn't wait for any resource and directly gets
into the CPU queue and spends long time only in runnable state, then
sys.dm_os_wait_stats doesn't reflect it. The Same scenario is explained in detail by MVP Linchi Shea over here.
In such a scenario, one can use sys.dm_os_schedulers to detect CPU pressure.
Consider the following query.
SELECT scheduler_id,
cpu_id,
current_tasks_count,
runnable_tasks_count,
current_workers_count,
active_workers_count,
work_queue_count
FROM sys.dm_os_schedulers
WHERE scheduler_id < 255;
Simple and straight forward query on sys.dm_os_schedulers DMV. Returns one row per CPU. Scheduler_id < 255 filters out schedulers used by system processes. Detailed explanation on the DMV can be obtained from here. Most important column is runnable_tasks_count which indicates the number of tasks that are waiting
on the runnable queue. Once a process moves out of the runnable state into running state, the value of the column reduces by one. So, the DMV always indicates the current state of the server and the runnable queue.dm_os_schedulers doesnt hold historical data since last restart unlike waitstats dmv. So, this needs to
polled lot more frequently, perhaps every 5 minutes if necessary. Any non zero value noted on runnable_tasks_count is a indication of CPU pressure and requires close monitoring.
To sum it up, CPU monitoring for SQL Server would include three parts.
* Directly checking CPU using sys.os_ring_buffers dmv as explained here.
* Checking waitstats dmv as explained here
* checking sys.os_schedulers as explained in this post.


