My blog has been listed in sql pass blog directory. Check it over here. No matter what, its a special feeling to see your blog and name listed along with the best in the industry ( though you are no where close to them ). Thanks SQL PASS.
Wednesday, June 30, 2010
SQL Pass blog directory

Monday, June 28, 2010
Rebuild vs ReOrg
Rebuild or Regorg, difference between Rebuild or Reorg is a fairly common topic on blogs and forums. Here is my take on it.As I am not good on writing tr and td html tags lemme list down the comparison as pointers instead of a tabular column.
Before starting the comparsions, just a small intro on fragmentation. I have written in detail on it over here. But still, a quick intro.
Database Fragmentation is of 2 types. Internal and external fragmentation.
>Internal Fragmentation refers to the fragmentation that happens with in a page.
>External fragmentation is divided to 2 types. Logical and extent fragmentation.
>Logical fragmentation refers to out of order pages within a extent.
>Extent fragmentation refers to out of order extents.
What Reorg does? :
Takes the leaf pages of each index, fixes the internal fragmentation by ensuring that each leaf page is filled as per the fillfactor specified initially while creating the index. Reorg also swaps and rearranges the out of order pages to fix logical fragmentation.
picture of an Sample Extent before Reorg: 
picture of Sample Extent after Reorg: 
What Rebuild does? :
Rebuild index recreates the index from scratch which means both the leaf and non leaf pages's internal fragmentation is removed.As it rebuilds the index completely it fixes logical fragmentation. Rebuild fixes extent fragmentation most of the
times, but there are a few exceptions.
Let us see the important differences/similarities.
New Page allocation difference - Reorg and Rebuild:
Reorg while fixing internal and logical fragmentation, uses only the existing pages that are allocated to the table.It never allocates new pages and moves around the existing pages to get the internal and logical fragmentation correct.Perhaps thats the reason its called 'Reorg'.
On the other hand Rebuild can allocate new pages, to fix logical and extent fragmentation. Allocating new pages means that Rebuild can sometimes increase the space usage in the data file.
Leaf level pages
As mentioned earlier, Reorg defragments only leaf level pages of a index and Rebuild defrags both leaf and non leaf levels of an index.
Extent fragmentation
Extents are a group of 8 pages, when not present physically in their logical order, is said to be extent fragmented.For ex: page 1-8 of table 1 are present in extent-1.if Pages-9 to 16 of the table, present in extent-2 is not physically stored after extent-1 then the table is said to extent fragmented.
Picture of Sample Extent Fragmented table: 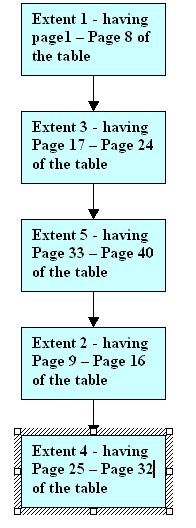
Picture of Extents storage order after Rebuild 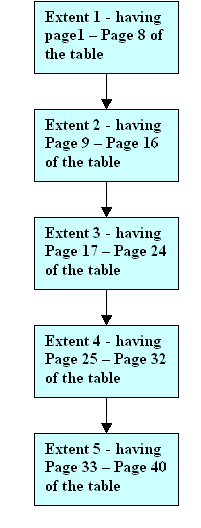
Locking - online/offline differences
Reorg is a online process. ie The table remains online during Reorg and updates and Inserts can be done to the table. Reorg takes Indent Exclusive lock at the table level. At page level, it takes exclusive lock only at the page at which is currently working on (swapping/ fixing internal frag ) and leaves the rest of the pages of the table. Once it finishes work on a single page, then it releases the exclusive lock and pulls a exclusive lock the next page it has to work on. If the system is too busy, Reorg sometimes skips the pages.
Rebuild is a offline process and consumes a exclusive lock on the entire table and stops any access to it until the operation finishes.However, Rebuild can be done online using the option ONLINE = ON,if and only if you have a Enterprise edition.
Stats differences
Rebuild of clustered index updates all the statistics assocaited with the table ( both auto and user created ) whereas Reorg doesn't do the same. The STATS_DATE function can be used to check the date at which statistics were last updated.
Log file growths
Both cause the log files to grow. Rebuild can be a minimally logged operation where as REOrg is a fully logged operation.
Stoping / Pausing REOrg
REOrg can be stopped during execution and can continue its execution from it where left.But Rebuild acts like a single transaction and always starts from scratch.
Lob differences
Rebuild of clustered index on a table with LOB column ( varchar(max),varbinary(max),image,xml,text ) fails when performed ONLINE.REOrg of Clustered index compacts LOB objects on the table. REOrg of a non clustered index compacts LOB columns that are part of the included non key columns of the NC Index.
Replacements
Reorg replaces DBCC Indexfrag and Rebuild replaces DBCC DBReindex. The DBCC commands still work on SQL Server 2005, but its recommended to switch to REorg/Rebuild.
Just a note about fragmentation. Fragmentation can hurt your servers performance only when your queries scan the tables instead of Seeking.If your indexes are well selected and accurate, then the queries should use seek operator to fetch the rows and as Seek directly jumps to the row it wants, it doesnt matter how much the table is fragemented or disordered.So, a occasional Reorg or rebuilt should be enough to keep your databases and tables healthy. In general, one perfoms Re0rg when fragmention is around 10 -30 % and rebuild when its greater than 30 %.
Monday, June 21, 2010
Perfmon - useful links
I have couple of useful links on Perfmon.
1) How to correlate Perfmon data with Profiler Data?
Perfmon data gives us the high level picture of what is causing a performance slowdown.Profiler shows what queries exactly running. Correlating both, tells which processes/queries were exactly responsible for a performance slowdown. The article describes neat and clean way provided by Microsoft tools to correlate perfmon and profiler data. Refer here.
for more details. Note that one needs SQL Server 2005 tools to use correlate functionality.
2) How to capture perfmon data directly into table?
Perfmon counter data can be automatically saved to SQL Servers table instead of binary file (blg) or csv file.Saving Perfmon counter into sql server table allows one to check perfmon counter values like CPU, memory, Disk usage % remotely by just using SSMS/ Query analyzer to connect to the server, without actually logging into the server. The above mentioned technique is one method which works in SQL 2000 to check the CPU of monitored instance remotely. Note that the method explained in last post doesn't work for SQL 2k. Refer here for detailed explanation.
The Perfmon data gets captured into two tables namely CounterDetails,CounterData. The details can be viewed using the following query.
SELECT counterdetails.objectname,
CASE
WHEN Isnull(instancename, '!@#$') = '!@#$' THEN ''
ELSE instancename
END AS instance_name,
counterdetails.countername AS counter_name,
counterdata.counterdatetime,
counterdata.countervalue
FROM counterdata,
counterdetails
WHERE counterdetails.counterid = counterdata.counterid
ORDER BY counterdata.counterdatetime
Sunday, June 13, 2010
Finding CPU utilization in SQL Server 2005:
Finding the CPU percentage used by SQL Server is perhaps the first step in performance monitoring. Often, finding the CPU % as shown by task manager, from SQL Server can be tricky as SQL Server's sysprocesses and exec_requests gives only CPU ticks and not the exact CPU % used. Logging into each and every server manually and checking the CPU can be a pain if you are administering a large number of servers. So here is a solution.
DECLARE @ts_now BIGINT
SELECT @ts_now = cpu_ticks / CONVERT(FLOAT, cpu_ticks_in_ms)
FROM sys.dm_os_sys_info
SELECT record_id,
Dateadd(ms, -1 * ( @ts_now - [timestamp] ), Getdate()) AS eventtime,
sqlprocessutilization,
systemidle,
100 - systemidle - sqlprocessutilization AS
otherprocessutilization
FROM (SELECT record.value('(./Record/@id)[1]', 'int')
AS record_id,
record.value('(./Record/SchedulerMonitorEvent/SystemHealth/SystemIdle)[1]',
'int')
AS systemidle,
record.value('(./Record/SchedulerMonitorEvent/SystemHealth/ProcessUtilization)[1]', 'int') AS sqlprocessutilization,
timestamp
FROM (SELECT timestamp,
CONVERT(XML, record) AS record
FROM sys.dm_os_ring_buffers
WHERE ring_buffer_type = N'RING_BUFFER_SCHEDULER_MONITOR'
AND record LIKE '%
ORDER BY record_id DESC
The script provided above provides the approximate CPU usage % as shown in task manager. The result is shown below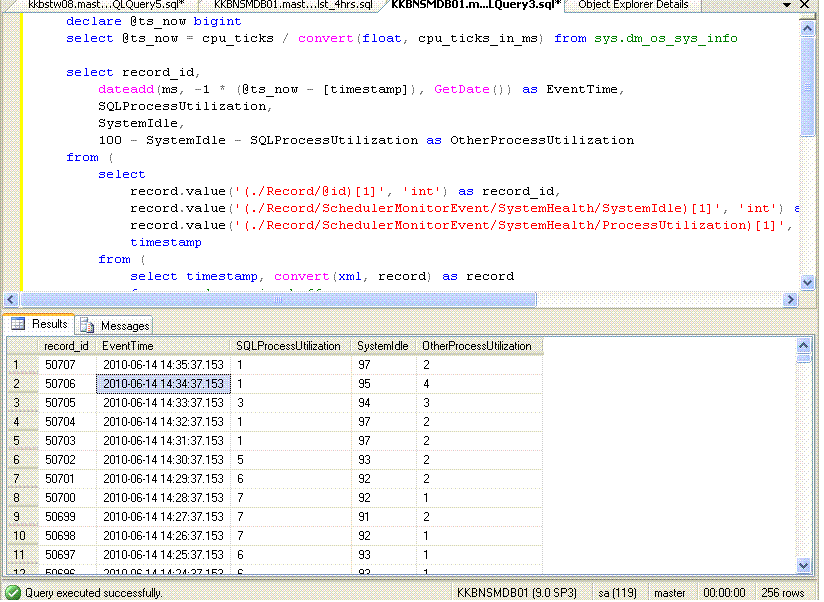
Column description is provided below:
SQLProcessutilization: Percentage used by SQL Server process ( sqlserver.exe)
OtherProcessutilization: Percentage used by other processes in the server
Eventtime: Time at which the CPU percentage was recorded.
systemidle: Perecentage of CPU left.
record_id: Just a incremental row id
The CPU percentage is obtained from sys.dm_os_ring_buffers DMV. sys.dm_os_ring_buffers records the CPU percentage
for every one minute and it maintains CPU % for the last 256 minutes. Like all DMVs if the server is restarted then
the DMVs lose the data.
Now for the credits :)
The Script provided above is obtained from the scripts deployed by Performance dashboard tool explained in the last post Performance Dashboard uses the sp [MS_PerfDashboard].[usp_Main_GetCPUHistory] for getting the reports on CPU. I just tweaked the sp to obtain the CPU % for 256 minutes instead of the last 15 minutes returned by Performance Dashboard. Thanks Performance Dashboard again :)
Wednesday, June 9, 2010
Performance Dashboard - SQL Server 2005 Performance monitoring tool
Performance Dashboard is a simple performance monitoring tool for SQL Server 2005 released by Microsoft which is absolutely FREE :) . Good and detailed explanation is given by Brad McGhee as usual over here. Let me briefly describe the salient features of it.
How to Set up?
* Download Performance dashboard.msi from here
* Install on the machine from which you want to monitor your production servers. The installation completes in seconds in 3-4 clicks and doesn't demand a restart.
* Proceed to C:\Program files\Microsoft SQL Server\90\Tools\PerformanceDashboard folder ( or the folder where you have installed SQL Server. Performance Dashboard is installed on the folder where where you have already installed SQL Server)
* Copy the Setup.sql script and execute it in the production servers to be monitored.
Thats it. You are ready to go.
How to use it?
* Open SSMS on the machine you installed Performance Dashboard.
* Connect to the instance/SQL Server to be monitored on the SSMS
* Right Click on the connect server on the object explorer
and Select Reports .
* Pick Custom Reports
* Select performance_dashboard_main.rdl from C:\Program files\Microsoft SQL Server\90\Tools\PerformanceDashboard
* And then experience the magic :)
Opening Dashboard Screen shot is provided below.
Why I like it?
* Can check CPU/Buffer cache hit ratio and overall health of Database Servers remotely from SSMS.
* Quickly check the recently ran expensive queries ( as per by IO/CPU/ along with their Query Plan
* Check the Database Size and Log file size, growth, and other paramaters with in a few clicks.
* Provides Missing indexes and suggestions to improve peformance. Also provides number of seeks/scans on the objects.
* Provides DB level IO stats like Reads, Write and their wait times.
* All these brilliant info at almost 0% cost on the monitored server.
Now for few minor cons.
* An alerting feature along with the tool would have been great.
* Also, there are one or two minor bugs for which solutions are already available.
* Ability to add perfmon counters as per our choice would have been even better.
* One cant do a direct copy or paste from the report, has to export to PDF /excel and then copy the required data.
But, am I asking for bit too much on a free tool. Definitely yes :) Inspite of these little cons,Performance Dashboard is a must have for all DBAs, especially if you are monitoring 25+ servers. Just very handy for quickly checking the overall state and health of the server without actually logging into the server. Other than showing larger picture, it helps even to narrow down up to the query level. Simply awesome stuff.
Sunday, June 6, 2010
Scalar functions - on where clause
Scalar functions as discussed in the last post can be a performance bottleneck.Another place where Scalar functions ( both user defined and system ) can become a performance bottleneck is when used on a where clause of the query. Scalar functions when used on a where clause of a query can make the optimizer pick a table scan, even if the index is present, making the index useless.
/****** Object: Index [ncix_Supplier_product_customer_trans_date] ******/
CREATE NONCLUSTERED INDEX [ncix_Supplier_product_customer_trans_date]
ON [dbo].[Supplier_Product_Customer] ( [trans_date] ASC )
ON [PRIMARY]
A non clustered index on trans_date column of supplier_product_customer table has been created.When one needs to find the list of transactions for a particular day ( cutting the time part of the , the most common method of writing the query would be
SELECT *
FROM [Supplier_Product_customer]
WHERE Datediff(dd, [trans_date], '11/19/2009') = 0
But,the problem with such a query is that it takes table scan instead of using the Non clustered index created on trans_date. The reason is that scalar function datediff used on trans_date column stops the query analyzer from using the index.
A better way of writing it would be
SELECT *
FROM supplier_product_customer
WHERE trans_date >= '20091119'
AND trans_date < '20091120' 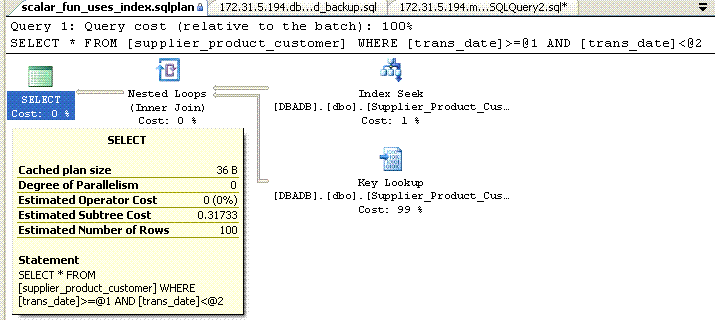
The picture above shows a non clustered index seek instead of table scan. There are few other common scenarios where functions can be avoided. Let me briefly list them here
* Left() string fuction can be effectively replaced by like
'str%'
* Usage of upper/lower string functions can be avoided
when the database has a case insensitive collation.
* isnull(col1,'xyz') = 'xyz' can be replaced by col1 = 'xyz'
or col1 is null
Note that OR conditions do use indexes and but at times they don't.
Please check before use.
* Getting data older than 60/n days query.
Standard way of doing it would be
Where datediff(dd, trans_date, getdate()) > 60
Replaced by
Where trans_date < CONVERT(VARCHAR, getdate()-60, 112)
To Conclude, one should try the best to avoid having scalar functions in where clauses.
Tuesday, May 25, 2010
Performance comparison - Functions versus Joins
User defined Scalar function is often chosen as a easier alternative for joining two or multiple tables while writing queries by developers. Other reason given by 'Few' developers is that its provides better readability on a long query. Both are bad reasons for using functions as scalar functions when used inappropriately can potentially kill the performance.
Scalar function when used on a query is executed for every row of the result set, just like a cursor would do. Row by Row processing is very very expensive when compared to SET based processing provided by joins. Scalar functions also makes indexes on the joined tables less effective or even useless.Above factors make joins, in general, a better option when they can replace a scalar function.
We will see the same with an example.
Consider the following tables student , student_marks . Student table contains student details and student_marks contain marks obtained by students on 5 subjects. Table definition and random data population scripts are provided below.
/***********************************************/
/************* Table [dbo].[student_marks]******/
CREATE TABLE [dbo].[student_marks]
(
[sid] [INT] NOT NULL,
[marks] [INT] NULL,
[subject_name] [VARCHAR](50) NOT NULL,
[subject_id] [INT] NOT NULL,
CONSTRAINT [PK_student_marks] PRIMARY KEY CLUSTERED ( [sid] ASC,
[subject_id] ASC )
)
ON [PRIMARY]
GO
/****** Table [dbo].[Student] ******/
CREATE TABLE [dbo].[Student]
(
[sid] [INT] NOT NULL,
[student_name] [VARCHAR](50) NULL,
CONSTRAINT [PK_Student] PRIMARY KEY CLUSTERED ( [sid] ASC )
)
ON [PRIMARY]
GO
Random data population scripts
/*************Student table data population*********/
DECLARE @id INT
SET @id = 0
WHILE @id <= 100000
BEGIN
INSERT INTO student
SELECT @id,
CHAR(( @id % 26 ) + 65) + '-' + CONVERT(VARCHAR, @id)
SET @id = @id + 1
END
GO
/*************Student_marks table population**********************/
INSERT INTO student_marks
SELECT sid,
Round(Abs(( Rand(sid + x.subid) * 1000000000000 ) - Round((
( Rand(sid + x.subid) *
1000000000000 ) / 100 ), 0) * 100), 0),
x.subject,
x.subid
FROM student,
(SELECT 'math' AS subject,
1 AS subid
UNION
SELECT 'physics',
2
UNION
SELECT 'chemistry',
3
UNION
SELECT 'computer_science',
4
UNION
SELECT 'tamil',
5) AS x
The Scripts provided would insert 100,001 rows in student table and 500,005 rows student marks table.Primary key clustered index has been created on sid column on student table and sid,subject_id columns on student_marks table.
Assume that the requirement is to provide the student names and marks of all students in the school.Solution using scalar function would involve creating a function to get student name from student table and querying the student_marks table for obtaining rest of the details. Simple function definition would look like
/****** Object: UserDefinedFunction [dbo].[student_name] ******/
SET ansi_nulls ON
GO
SET quoted_identifier ON
GO
CREATE FUNCTION [dbo].[Student_name](@sid INT)
RETURNS VARCHAR(50)
AS
BEGIN
DECLARE @student_name VARCHAR(50)
SELECT @student_name = student_name
FROM student
WHERE sid = @sid
RETURN @student_name
END
After creating the function, the following query using scalar function is executed.
SET statistics io ON
GO
DECLARE @dt DATETIME
SET @dt = Getdate()
SELECT dbo.Student_name(sid),
*
FROM student_marks
WHERE sid < 20000
SELECT Datediff(ms, @dt, Getdate())
Perfomance Stats are provided below:
Time taken :55640 ms ( 0:56 Seconds)
Rows Returned :100000
IO details : Table Table 'student_marks'. Scan count 1, logical reads 415, physical reads 56, read-ahead reads 412, lob logical reads 0, lob physical reads 0, lob read-ahead reads 0.
Query plan: 
The query plan doesnt show whats exactly happening with in the function/
how many times was the function precisely called.So, to find the same, let me use the DMV dm_exec_query_Stats
SELECT Substring(TEXT, ( statement_start_offset / 2 ) + 1, ( ( CASE
statement_end_offset
WHEN -1 THEN Datalength(TEXT)
ELSE statement_end_offset
END
- statement_start_offset ) / 2 ) + 1) AS statement_text,
Isnull(Object_name(objectid), '-') AS obj_name,
execution_count,
max_elapsed_time,
max_logical_reads,
max_logical_writes
FROM sys.dm_exec_query_stats
OUTER APPLY sys.Dm_exec_sql_text(plan_handle) AS sqltext
WHERE TEXT NOT LIKE '%dm_exec_query_Stats%'
ORDER BY execution_count DESC 
Execution count column on dm_exec_query_stats DMV clearly shows that the query Select dbo.student_name(sid),* From student_marks where sid < 20000 in the function dbo.student_name has been executed 10000 times , which is exactly the same number of rows returned. So its basically passing a number ( sid ) and making the functions' code execute over and over which makes it painfully slow.
Let us Consider the join based solution:
SET statistics io ON
GO
DECLARE @dt DATETIME
SET @dt = Getdate()
SELECT student_name,
student_marks.*
FROM student_marks,
student
WHERE student_marks.sid = student.sid
AND student_marks.sid < 20000
SELECT Datediff(ms, @dt, Getdate())
Performance Stats :
Time taken : 2876 ms ( 2.9 Seconds)
Rows Returned: 100,000
IO details : Table 'student_marks'. Scan count 1, logical reads 415, physical reads 3, read-ahead reads 412, lob logical reads 0, lob physical reads 0, lob read-ahead reads 0.
Table 'Student'. Scan count 1, logical reads 60, physical reads 1, read-ahead reads 58, lob logical reads 0, lob physical reads 0, lob read-ahead reads 0.
Query plan: 
Join based solution completes the query in less than three seconds, which is 20 times faster than Scalar functions. IO also indicates lesser number of reads. The student table is also read only once against 100,000 times as in the case of scalar functions. Query Stats DMV confirm the same.
So the conclusion is, one should always avoid using scalar functions as much as possible and should be used only when we don't have any other option to replace it.Complex string manipulation requirements or date calculation requirements are perhaps, plausible excuses for Scalar functions, but still they have to be used with caution as they have been found as performance bottlenecks more often than not.
Subscribe to:
Posts (Atom)