User defined Scalar function is often chosen as a easier alternative for joining two or multiple tables while writing queries by developers. Other reason given by 'Few' developers is that its provides better readability on a long query. Both are bad reasons for using functions as scalar functions when used inappropriately can potentially kill the performance.
Scalar function when used on a query is executed for every row of the result set, just like a cursor would do. Row by Row processing is very very expensive when compared to SET based processing provided by joins. Scalar functions also makes indexes on the joined tables less effective or even useless.Above factors make joins, in general, a better option when they can replace a scalar function.
We will see the same with an example.
Consider the following tables student , student_marks . Student table contains student details and student_marks contain marks obtained by students on 5 subjects. Table definition and random data population scripts are provided below.
/***********************************************/
/************* Table [dbo].[student_marks]******/
CREATE TABLE [dbo].[student_marks]
(
[sid] [INT] NOT NULL,
[marks] [INT] NULL,
[subject_name] [VARCHAR](50) NOT NULL,
[subject_id] [INT] NOT NULL,
CONSTRAINT [PK_student_marks] PRIMARY KEY CLUSTERED ( [sid] ASC,
[subject_id] ASC )
)
ON [PRIMARY]
GO
/****** Table [dbo].[Student] ******/
CREATE TABLE [dbo].[Student]
(
[sid] [INT] NOT NULL,
[student_name] [VARCHAR](50) NULL,
CONSTRAINT [PK_Student] PRIMARY KEY CLUSTERED ( [sid] ASC )
)
ON [PRIMARY]
GO
Random data population scripts
/*************Student table data population*********/
DECLARE @id INT
SET @id = 0
WHILE @id <= 100000
BEGIN
INSERT INTO student
SELECT @id,
CHAR(( @id % 26 ) + 65) + '-' + CONVERT(VARCHAR, @id)
SET @id = @id + 1
END
GO
/*************Student_marks table population**********************/
INSERT INTO student_marks
SELECT sid,
Round(Abs(( Rand(sid + x.subid) * 1000000000000 ) - Round((
( Rand(sid + x.subid) *
1000000000000 ) / 100 ), 0) * 100), 0),
x.subject,
x.subid
FROM student,
(SELECT 'math' AS subject,
1 AS subid
UNION
SELECT 'physics',
2
UNION
SELECT 'chemistry',
3
UNION
SELECT 'computer_science',
4
UNION
SELECT 'tamil',
5) AS x
The Scripts provided would insert 100,001 rows in student table and 500,005 rows student marks table.Primary key clustered index has been created on sid column on student table and sid,subject_id columns on student_marks table.
Assume that the requirement is to provide the student names and marks of all students in the school.Solution using scalar function would involve creating a function to get student name from student table and querying the student_marks table for obtaining rest of the details. Simple function definition would look like
/****** Object: UserDefinedFunction [dbo].[student_name] ******/
SET ansi_nulls ON
GO
SET quoted_identifier ON
GO
CREATE FUNCTION [dbo].[Student_name](@sid INT)
RETURNS VARCHAR(50)
AS
BEGIN
DECLARE @student_name VARCHAR(50)
SELECT @student_name = student_name
FROM student
WHERE sid = @sid
RETURN @student_name
END
After creating the function, the following query using scalar function is executed.
SET statistics io ON
GO
DECLARE @dt DATETIME
SET @dt = Getdate()
SELECT dbo.Student_name(sid),
*
FROM student_marks
WHERE sid < 20000
SELECT Datediff(ms, @dt, Getdate())
Perfomance Stats are provided below:
Time taken :55640 ms ( 0:56 Seconds)
Rows Returned :100000
IO details : Table Table 'student_marks'. Scan count 1, logical reads 415, physical reads 56, read-ahead reads 412, lob logical reads 0, lob physical reads 0, lob read-ahead reads 0.
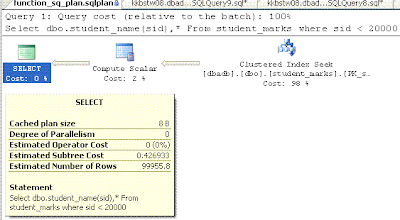
Query plan:
The query plan doesnt show whats exactly happening with in the function/
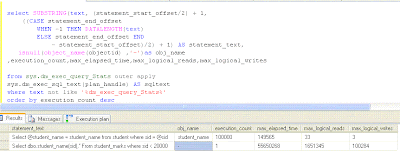
how many times was the function precisely called.So, to find the same, let me use the DMV dm_exec_query_Stats
SELECT Substring(TEXT, ( statement_start_offset / 2 ) + 1, ( ( CASE
statement_end_offset
WHEN -1 THEN Datalength(TEXT)
ELSE statement_end_offset
END
- statement_start_offset ) / 2 ) + 1) AS statement_text,
Isnull(Object_name(objectid), '-') AS obj_name,
execution_count,
max_elapsed_time,
max_logical_reads,
max_logical_writes
FROM sys.dm_exec_query_stats
OUTER APPLY sys.Dm_exec_sql_text(plan_handle) AS sqltext
WHERE TEXT NOT LIKE '%dm_exec_query_Stats%'
ORDER BY execution_count DESC
Execution count column on dm_exec_query_stats DMV clearly shows that the query Select dbo.student_name(sid),* From student_marks where sid < 20000 in the function dbo.student_name has been executed 10000 times , which is exactly the same number of rows returned. So its basically passing a number ( sid ) and making the functions' code execute over and over which makes it painfully slow.
Let us Consider the join based solution:
SET statistics io ON
GO
DECLARE @dt DATETIME
SET @dt = Getdate()
SELECT student_name,
student_marks.*
FROM student_marks,
student
WHERE student_marks.sid = student.sid
AND student_marks.sid < 20000
SELECT Datediff(ms, @dt, Getdate())
Performance Stats :
Time taken : 2876 ms ( 2.9 Seconds)
Rows Returned: 100,000
IO details : Table 'student_marks'. Scan count 1, logical reads 415, physical reads 3, read-ahead reads 412, lob logical reads 0, lob physical reads 0, lob read-ahead reads 0.
Table 'Student'. Scan count 1, logical reads 60, physical reads 1, read-ahead reads 58, lob logical reads 0, lob physical reads 0, lob read-ahead reads 0.
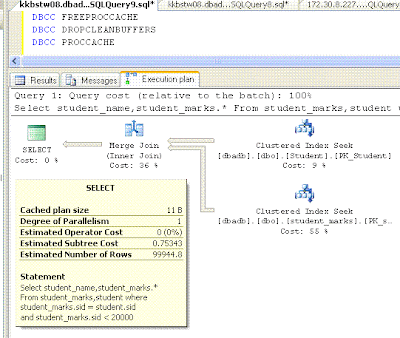
Query plan:
Join based solution completes the query in less than three seconds, which is 20 times faster than Scalar functions. IO also indicates lesser number of reads. The student table is also read only once against 100,000 times as in the case of scalar functions. Query Stats DMV confirm the same.
So the conclusion is, one should always avoid using scalar functions as much as possible and should be used only when we don't have any other option to replace it.Complex string manipulation requirements or date calculation requirements are perhaps, plausible excuses for Scalar functions, but still they have to be used with caution as they have been found as performance bottlenecks more often than not.
Tuesday, May 25, 2010
Performance comparison - Functions versus Joins
Wednesday, May 19, 2010
SQLDiag
When one needs to monitor a servers performance, one has to make use of the Performance monitor to capture the system parameters and obtain the bigger picture, identify the bottleneck and then use profiler utility to identify the queries causing the performance slowdown.
Instead of using multiple tools to gather performance data, SQLDIAG is a single utility which is capable of capturing the following.
* Queries executed and corresponding events.
* Performance counters
* Error logs
* SQL Server blocks and resource usage information.
* SQL Server version and configuration information.
SQLDiag is a command line utility where one can configure the things to be captured in a XML file.SQLDiag is found in the drive in which SQL Executables are installed,with the path '..\Microsoft SQL Server\90\Tools\Binn\' . SQLDiag takes a few input parameters like XML file to be taken as input, place to write the captured results etc. Once started provides the captured results into the specified folder.
Details about useful output files are provided below.
1) SQLDIAG.BLG - Stores the perfmon counters values asked for
2)
details
3) ***_sp_SQLDiag_shutdown.OUT- Provides the sqlerrorlog,current
running queries,open transaction,configuration info, blocking query
info taken at the time of stopping SQLDiag.
Sample call is provided below:
START SQLDIAG /I "%cd%\customized.XML" /O "%cd%\SQLDiagOutput" /P
"%cd%" Refers to the current directory. customized.XML is the XML I prepared for capturing data. SQLServer by default ships SQLDIAG.XML which can be used to capture data. SQLDIAG.XML captures a whole lot of data with too many counters and too
many profiler events. Instead, I have created a customized XML which grabs important 15 - 20 counters and queries that are executed against the database. Customized.xml can be downloaded from here. There are very few resources on SQLDiag the
net.Refer here for more details.
SQLDiag's advantages and drawbacks are provided below:
Advantages:
* Single tool to capture all the data required.
* Can be easily reused across servers as its just a single XML file which
contains all the configuration and settings
* Can be run as a Service
Disadvantages :
* Cant be configured from a remote machine. One needs to be logged in to the
actual server.
Stores the data only on the monitored instance.
* Changing XML can be bit tedious and difficult.
* No performance gain when compared to profiler/perfmon. Incurs the same
amount of resouces as other tools.
* Doesnt store data on the database which can make it easier for analysis.
Stores only on trc/text files.
Tuesday, May 11, 2010
Getting the IP Address and port no on SQL Server 2000,SQL Server 2005
This is my 50th Post. Thanks a lot for all the readers for your support.
Now for the actual topic.
Finding the IP address and port number of a SQL Server from a remote client can be tricky especially if you are on SQL Server 2000.I am never a big fan of xp_cmdshell . So I am not using xp_cmdshell 'ipconfig'. The alternative method that works for me is reading the SQL Error log thro sp_readerrorlog . Run the following command
EXEC Sp_readerrorlog
GO
sp_readerrorlog provides an output as shown below.
If you scroll 20 to 25 lines ( varies from server to server ) of output, you should find the text 'SQL Server is listening on IP Address : Port no'. Note that we can also find the port at which SQL Server is listening for connections. By default SQL Server listens for connections at 1433.
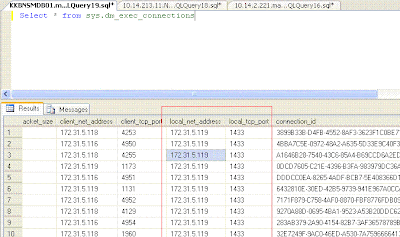
If you are on SQL Server 2005, then you are life is made lot easier using the DMV sys.dm_exec_connections.Execute the following query
SELECT *
FROM sys.dm_exec_connections
The local_net_address,local_tcp_port columns on the DMV dm_exec_connections provides the IP Address of the SQL Server and the port at which SQL Server listens for connections. Additionally columns Client_net_address,Client_tcp_port indicate the ip addresses that are currently connected to SQL Server and the the source ports from which they are connecting to.
Monday, May 3, 2010
Clustering - few useful documents
This is One of best articles I have read on clustering.
Very complete, and provides info on just about every task we happen to perform
on clustered servers. Must have for a DBA, if any of your servers are clustered.
Download from here. Best part its a white paper provided by Microsoft itself :)
In case, if you want to read on how to install clustered sql server with some simple
screen-shots, you can also refer to embarrassingly simple article written by Brad Mcghee here.
Enjoy.
Friday, April 30, 2010
Plan Cache - Part 3 - What gets recompiled
As a continuation of series of posts on Plan caching, let us get started with Part -3
Earlier posts are given below:
Plan caching - part-1 - Introduction
Plan caching - part-2 - What gets cached
Last post explained how stored procedures,prepared statements are cached. But there are a few scenarios where caching doesn't work, and object/query plan in the cache gets recompiled. Recompilation is the process where SQL Server finds that the plan in the cache is no good/invalid and creates a new plan for the query submitted. So lets get started. The following scenarios cause recompilation.
* A change in the structure/definition of the object
If the structure of the stored proc/table(Add/delete column, constraint,
index) has changed since last execution then the plan is obviously
invalid and hence it has to be recompiled.
We are using the same stored procedure test_plan_caching defined in the last post. Consider the following script.
DBCC freeproccache --Clear the cache as usual
EXEC Test_plan_caching 'moscow' --Call the SP
GO
ALTER PROCEDURE [dbo].[Test_plan_caching] @city VARCHAR(50)
AS
SELECT supplier_xid,
product_xid,
trans_city,
qty,
comments,
balance_left
FROM supplier_product_customer
WHERE trans_city = @city
ORDER BY supplier_xid DESC
GO
--Forcing an alter to the sp, though no logical change has been done
EXEC Test_plan_caching 'moscow'--Call the SP
SELECT TEXT,
usecounts,
size_in_bytes,
cacheobjtype,
objtype
FROM sys.dm_exec_cached_plans
OUTER APPLY sys.Dm_exec_sql_text(plan_handle) AS sqltext
WHERE TEXT NOT LIKE '%dm_exec_cached_plans%'
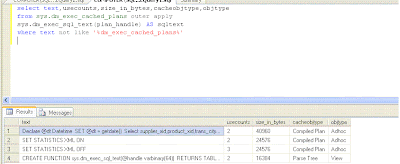
Alter made on the sp forced the optimizer to recreate the plan.
Similar changes that can cause such recompilations are adding/dropping an index,changing a trigger/proc/view definition etc.
* A change in the connection parameters using SET command .
Changing the following connection parameters using SET keyword can cause recompilation.
ANSI_NULL_DFLT_OFF/ANSI_NULL_DFLT_ON/ANSI_NULLS/ANSI_PADDING/ANSI_WARNINGS
/ARITHABORT/CONCAT_NULL_YIELDS_NULL/DATEFIRST/DATEFORMAT/FORCEPLAN/LANGUAGE
/NO_BROWSETABLE/NUMERIC_ROUNDABORT/QUOTED_IDENTIFIER
DBCC freeproccache
GO
EXEC Test_plan_caching 'San Franciso'
GO
SET ansi_null_dflt_off ON
GO
EXEC Test_plan_caching 'San Franciso'
GO
Query stats DMV clearly shows two plans. One for the plan generated before setting ANSI_NULL_DFLT_OFF and other for the plan with different value on ANSI_NULL_DFLT_OFF.
Note that a change of option 'ANSI_NULL/QUOTED_IDENTIFIER' doesn't affect a Stored proc or Table valued function. But it does affect Adhoc queries or prepared statements.
* A Forced recompilation
When a Object is marked for recompilation using sp_recompile stored procedure or when with recompile hint is used then query is recompiled.
Example:
EXEC Sp_recompile 'test_plan_caching'
The statement above ensures that next call made to test_plan_caching results in a recomplie.
When a procedure is created with an option WITH RECOMPILE, any call made to the stored proc
is always recompiled.
usage of hint OPTION RECOMPILE causes a statement level recompilation.
The scenarios where these options are useful are potential posts on their own. Will cover them soon.
* A change in statistics, caused by changes done to most of the rows in the table.
A rough algorithm of how SQL Server decides whether the table needs an updated statistics is given below. The algorithm changes is based on RT factor ( Recompilation threshold ) which depends on the number of changes made to the table.
If a table contains less than 500 rows then atleast 500 changes are required to cause a recompilation.If a table has more than 500 rows, then number of changes required are 500 + 20 % of rowcount.
As the algorithm changes with version and service pack releases, its approximate.
Saturday, April 24, 2010
Plan cache - part 2 - What gets cached
In general, we can classify queries submitted into three catogories.
They are
1) Adhoc queries -> The ones submitted thro query analyzer or the queries from applications which are not prepared statments ( executed as just statement without setting any parameter ).
2) SQL objects -> calls made to Stored procs, Triggers, UDFs, system and extended procs
3) Prepared Statements -> Sp_executesql with parameters,Prepared statements from applications.
Calls to sql objects and prepared statements are more likely to be cached. Let us see it in detail.Consider the following adhoc query:
DBCC freeproccache -- Just to free the cache before we start the experiments.
SELECT supplier_xid,
product_xid,
trans_city,
qty,
comments,
balance_left
FROM supplier_product_customer
WHERE trans_city = 'San Franciso'
ORDER BY supplier_xid DESC
Let us change the parameter and execute again
SELECT supplier_xid,
product_xid,
trans_city,
qty,
comments,
balance_left
FROM supplier_product_customer
WHERE trans_city = 'Perth'
ORDER BY supplier_xid DESC
To check whether the query was cached or not let me fire the query on DMV cached plans.
SELECT TEXT,
usecounts,
size_in_bytes,
cacheobjtype,
objtype
FROM sys.dm_exec_cached_plans
OUTER APPLY sys.Dm_exec_sql_text(plan_handle) AS sqltext
WHERE TEXT NOT LIKE '%dm_exec_cached_plans%'
The usecounts column has a value 1 which indicates clearly that the query was not cached. By default, adhoc queries are cached only when there is a exact match. A hange in parameter, even a change in case or additional space in the query results in sql server not reusing the query plan prepared eariler.
Let us make it a Stored proc and try the query again.
CREATE PROCEDURE Test_plan_caching @city VARCHAR(50)
AS
SELECT supplier_xid,
product_xid,
trans_city,
qty,
comments,
balance_left
FROM supplier_product_customer
WHERE trans_city = @city
ORDER BY supplier_xid DESC
GO
EXEC Test_plan_caching 'San Franciso'
GO
EXEC Test_plan_caching 'Perth'
GO
A query to DMV cached plan shows that the query plan has been reused.
Now let us try sp_executesql method. Consider the following script
DECLARE @SQLString NVARCHAR(1000)
DECLARE @paramstring NVARCHAR(100)
DECLARE @city VARCHAR(100)
SET @SQLString = 'Select supplier_xid,product_xid,trans_city,qty,comments,balance_left from ' + 'Supplier_Product_Customer where trans_city = @variable order by supplier_xid desc '
SET @paramstring = '@variable varchar(100)'
SET @city = 'San Franciso'
EXEC Sp_executesql
@SQLString,
@paramstring,
@variable = @City
SET @city = 'Perth'
EXEC Sp_executesql
@SQLString,
@paramstring,
@variable = @City
Note that we have changed the parameters by setting a new value to input variable and executed the same query.
DMV cached plan shows that query is getting reused. Bear in mind that mere usage of sp_executesql without using input parameter doesnt reuse the plan.
Note that the object type column on DMV cached plan indicates the kind of object that has been cached. Proc refers to procedure, Prepared refers to prepared plans created by sp_executesql and by application queries and Adhoc refers to adhoc queries.
There are still a few exception scenarios where a stored procedure plan doesnt get effectively reused.We will explore them more in the next post.
Friday, April 16, 2010
Plan cache - Introduction
When a query is submitted to SQL server, the query optimiser checks the syntax, verifies the objects and prepares a query plan. A query plan prepared is stored in a area of memory called plan cache . A plan placed in plan cache will be reused when a same query or 'similar query' is submitted to the query analyzer. Preparing a plan everytime can be expensive and time consuming task
and hence the query optimiser attempts to resuse a plan when it is supposed to.
A quick example.
DECLARE @dt DATETIME
SET @dt = Getdate()
SELECT supplier_xid,
product_xid,
trans_city,
qty,
comments,
balance_left
FROM supplier_product_customer
WHERE trans_city IN( 'San Franciso', 'Perth' )
ORDER BY supplier_xid DESC
SELECT Datediff(ms, @dt, Getdate())
First, the above query is executed. The table contains about 110,000 rows and the query returns about 45000 rows.The query returned the results first time in 1217 ms.
Let us execute the same script again. The script completes in 626 ms which is about half of first execution's time. When executing for the second time,The table's query plan is already in the cache and hence it is reused. We can check whether our query is cached or not using the dmv sys.dm_exec_cached_plans. The following query helps us find the same.
SELECT TEXT,
usecounts,
size_in_bytes,
cacheobjtype,
objtype
FROM sys.dm_exec_cached_plans
OUTER APPLY sys.Dm_exec_sql_text(plan_handle) AS sqltext
WHERE TEXT NOT LIKE '%dm_exec_cached_plans%'
Observe the result provided above. The text column provides the query and usercounts indicates how many times the plan has been used. For the above script, usecounts value is 2 and hence it indicates that the query has been reused.
In general, the queries that are 'likely' to be cached and used are as follows.
* Stored procedures, Triggers, Table valued functions.
* Prepared Statements used from applications ( from java/.net/c# etc )
* Queries executed using sp_executesql with input paramters.
As always there are a few exceptions and thats the reason the word 'likely' is in place.
What is written here is just the tip of the iceberg and we will explore more and more on the caching, pros and cons of caching,and the way plan cache works in the next few posts.
